EPA MPG vs Real-World MPG: Why Your Numbers Differ
EPA ratings come from standardized lab tests, not your commute. Here is how the testing works, the reasons real-world mileage differs, and how to measure your own MPG accurately.
EPA fuel economy ratings come from standardized laboratory tests that are designed to let you compare cars fairly, not to predict your exact mileage. Your results will differ because of how fast you drive, the weather, trip length, air conditioning use, tire pressure, load and the condition of the car. Plenty of drivers match or beat the label. Plenty fall short. The label is best used as a yardstick between vehicles, and your own measured MPG is the number to use for budgeting.
How the EPA tests work
Fuel economy tests are run on a dynamometer, a kind of treadmill for cars, in a controlled lab. A professional driver follows a set speed trace second by second while the exhaust is collected and measured. Fuel use is calculated from the carbon in the exhaust. Testing the car on rollers indoors removes the variables of weather, traffic and road surface, so every vehicle faces the same conditions.
Most of the testing is done by manufacturers following EPA procedures, and the EPA confirms results by testing a share of vehicles at its own lab.
The five-cycle method
Starting with the 2008 model year, the EPA changed how label values are calculated to better reflect real driving. Older ratings relied on two tests (a city cycle and a highway cycle) with fixed downward adjustments. The current approach draws on five test cycles:
- City (FTP): stop-and-go urban driving from a cold start.
- Highway (HWFET): steady, moderate-speed driving with no stops.
- High speed (US06): faster speeds and harder acceleration.
- Air conditioning (SC03): driving in hot conditions with the AC running.
- Cold temperature: the city cycle run at about 20°F.
The change lowered ratings for most vehicles compared with the old method. That is worth remembering if you compare a 2006 car's label with a 2010 car's. Ratings shown on fueleconomy.gov for older models were recalculated to the newer method so they line up better, which is why an old window sticker and today's database can disagree.
The combined figure is a weighted average of city and highway, with city counting for 55 percent and highway for 45 percent.
Why your mileage differs
Speed
Aerodynamic drag rises sharply with speed. Most cars reach their best fuel economy somewhere in the 40 to 60 mph range, and mileage drops quickly above that. Driving 75 mph instead of 65 can cost a noticeable share of your highway economy. If your commute is mostly fast interstate, the highway number on the label may be optimistic for you.
Cold weather
A cold engine runs rich until it warms up, oil and transmission fluid are thicker, winter-blend gasoline holds slightly less energy, and tire pressure drops. Short trips in winter can cut mileage substantially. Hybrids often take a bigger hit, because the engine runs more to provide cabin heat and keep the system warm.
Short trips
The first few miles after a cold start are the least efficient. A car used mainly for short errands may never reach operating temperature, and its average will sit well below the label.
Air conditioning
Running the AC adds load to the engine. The effect is largest in hot weather and in stop-and-go traffic.
Tires and maintenance
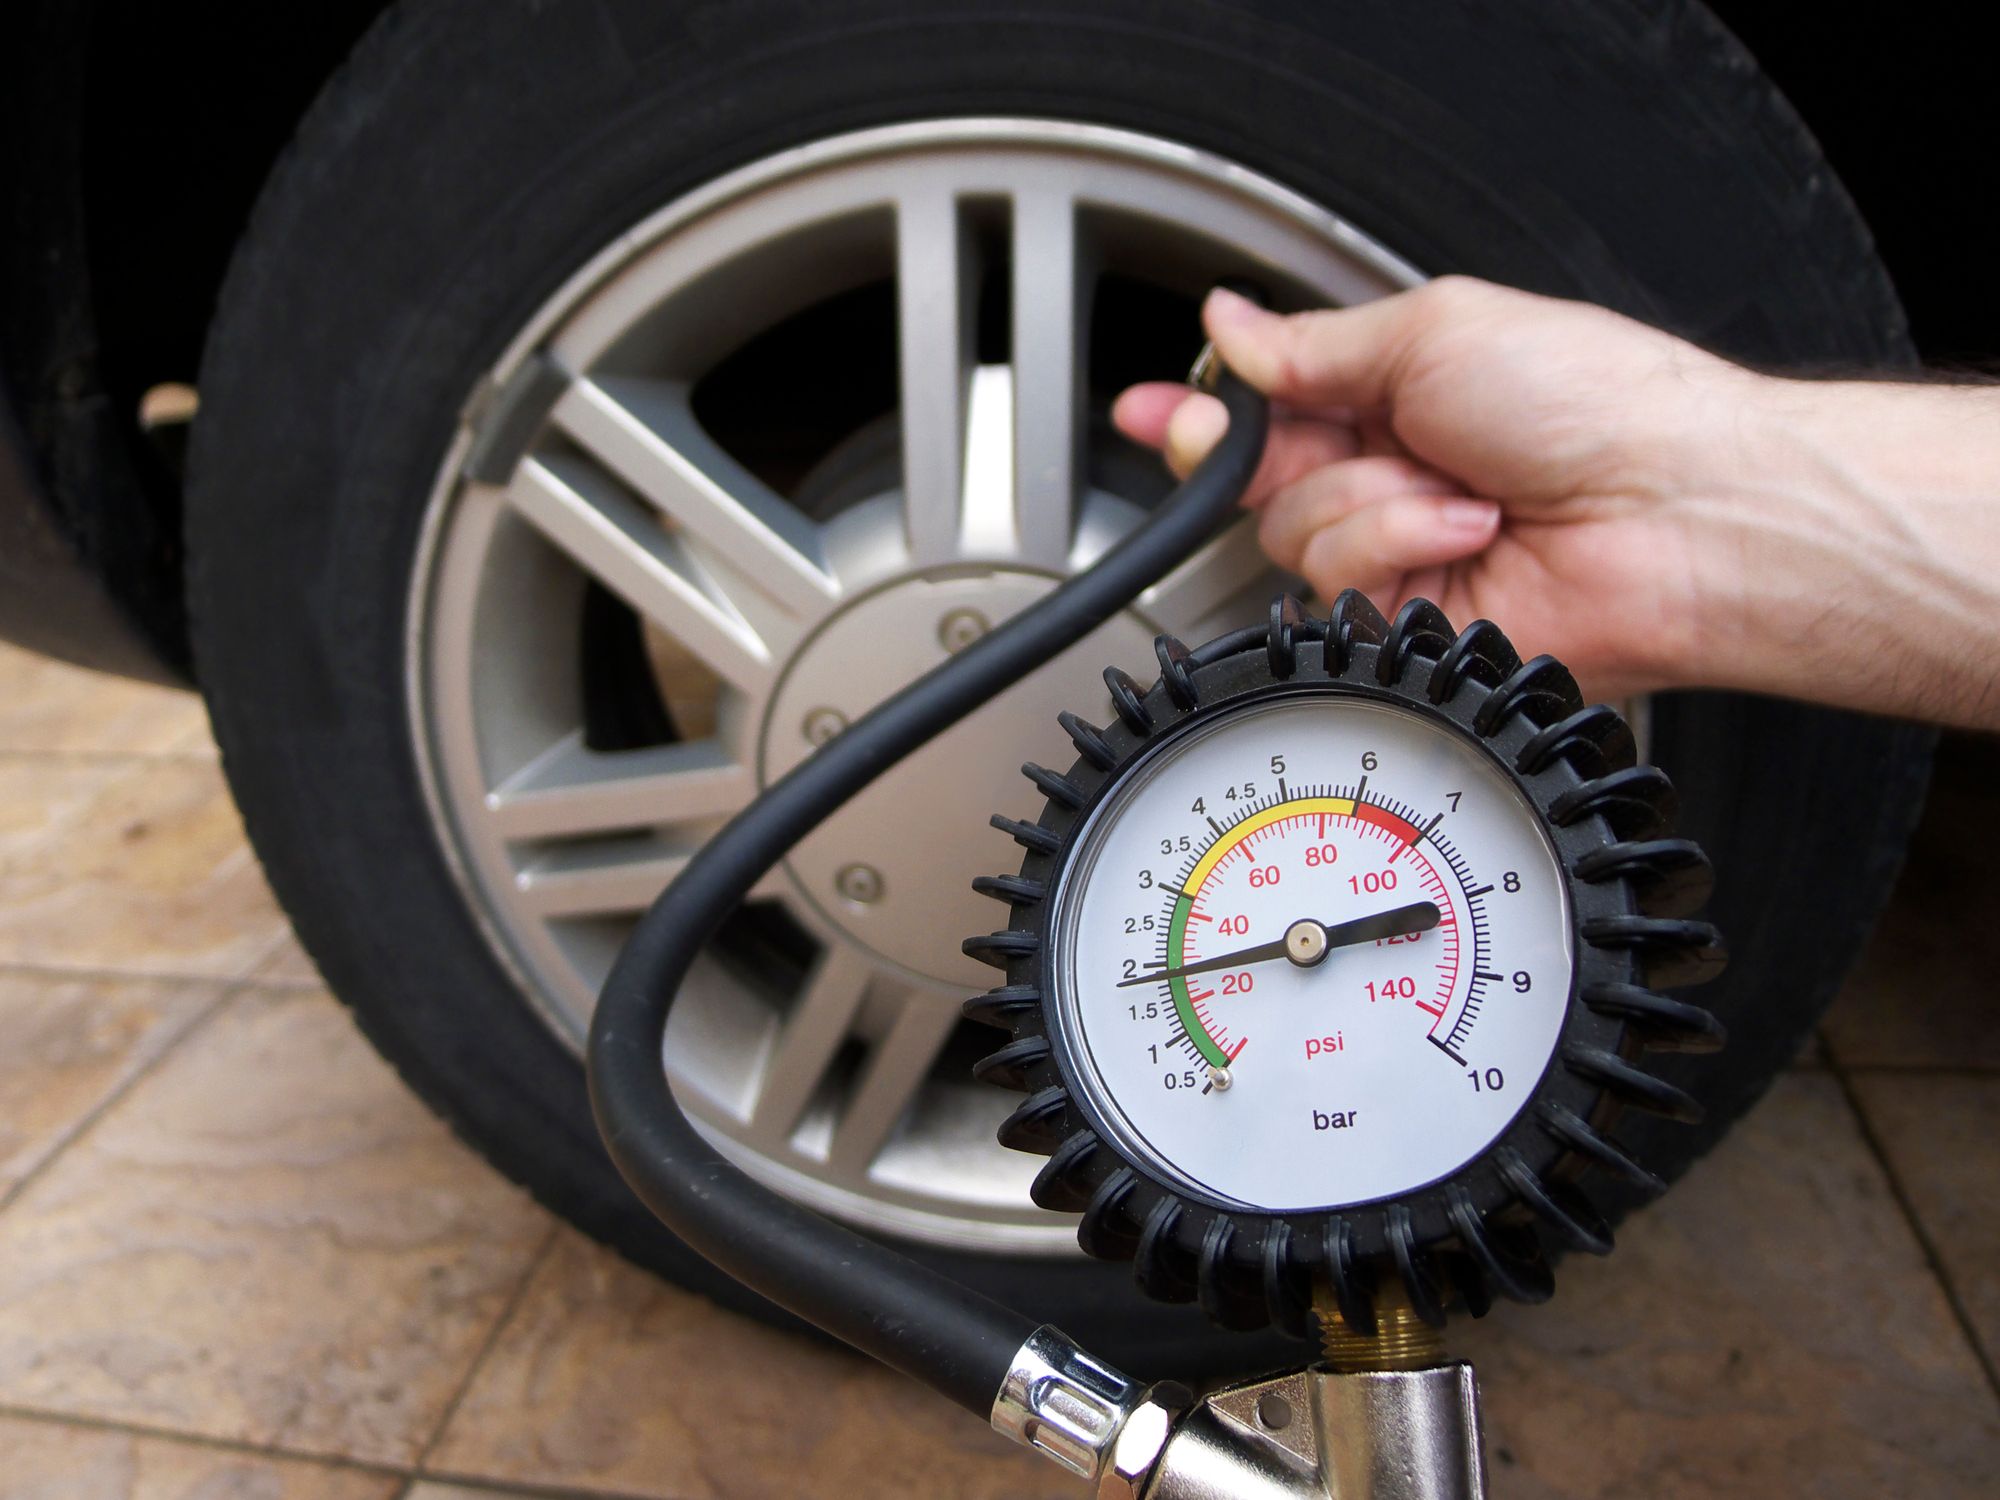
Underinflated tires increase rolling resistance. Replacement tires that are heavier or more aggressive than the originals can also cost mileage. See our guide to tire pressure and fuel economy.
Load, racks and towing
Extra weight, roof racks and cargo boxes, and towing all raise fuel use. A roof box can hurt highway mileage noticeably because of the drag it adds.
Driving style
Hard acceleration and late braking waste fuel. Smooth driving with gentle starts and early, gradual stops is one of the easiest ways to close the gap with the label.
Hybrids and electric cars
Hybrids are most efficient in stop-and-go driving, where they can recover braking energy and shut the engine off. On a fast highway run they lose much of that advantage, and in cold weather the engine runs more often to supply heat. So a hybrid driver who commutes mostly on the interstate, or lives somewhere cold, may see a bigger gap below the label than the owner of a conventional car. Electric vehicles show the same pattern even more strongly, as we cover in EV range in cold weather.
Small habits that close the gap
- Keep tires at the pressure on the door jamb placard and check it monthly.
- Take roof racks and cargo boxes off when you are not using them.
- Combine short errands into one trip so the engine spends more time warm.
- Ease off a little on the highway. Dropping from 75 to 65 mph often makes a noticeable difference.
- Avoid long idling. Modern engines do not need extended warm-ups, and gentle driving warms them faster.
- Keep up with maintenance, including air filters and the correct grade of oil.
How to measure your own MPG
The trip computer is a convenient estimate, but many read a little high. To get a true number:
- Fill the tank until the pump clicks off the first time. Do not top off.
- Reset a trip odometer, or write down the odometer reading.
- Drive normally until you need fuel again.
- Fill up the same way, ideally at the same pump, and note the gallons.
- Divide the miles driven by the gallons added.
Example: 312 miles on 11.4 gallons is 312 ÷ 11.4 = 27.4 mpg. Repeat over several tanks and average them, since a single tank can be skewed by how the pump shuts off. Track summer and winter separately if you want to see the seasonal swing.
Comparing cars with EPA numbers
Even if your own results run lower, the label is still the right tool for comparing vehicles, because every car goes through the same tests. A car rated 10 mpg better than another will usually do better for you too, in roughly the same proportion. You can see the combined figures we show for any model year on its MPG page. For example:
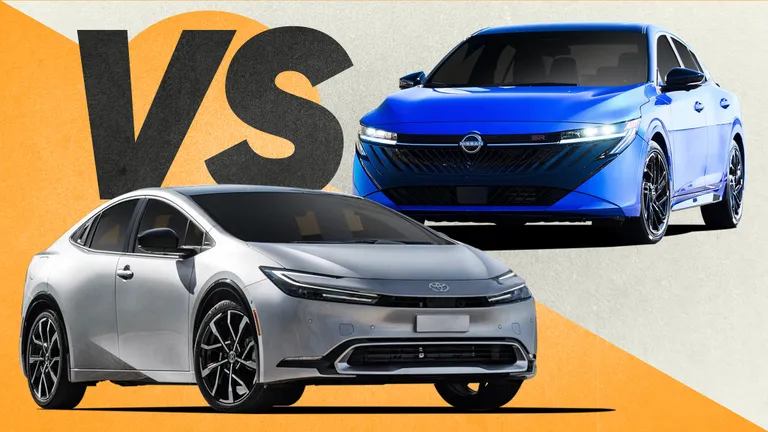
- The 2024 Toyota Prius is shown at 57 mpg combined.
- The 2024 Honda Civic is shown at 33 mpg combined.
- The 2024 Ford F-150 is shown at 19 mpg combined.
Figures for a specific trim can differ depending on engine, transmission and drive type, so check the exact configuration. The official source for every rated vehicle is fueleconomy.gov, which also collects mileage reports shared by owners. To turn MPG into dollars, see how to calculate annual fuel cost.